ScoreSG Performance Results
ScoreSG is the approximate graph-construction path of Core-SG. It is designed
for the same repeated multi-k workflow, but it avoids the most expensive
exact construction steps by using approximate neighbor discovery and a lighter
support graph. In the benchmark data currently available in this repository,
ScoreSG is represented by the core_sg_cython_*.csv result files.
This page should be read as the main performance evidence for overcoming the
traditional exact CoreSG n_samples limitation. Exact CoreSG reuses work
across k values, but it still depends on dense pairwise distance
information. ScoreSG is the scalable approximate path intended for cases where
that dense construction becomes the bottleneck.
The main performance question is whether the approximate construction changes the cumulative runtime regime when many hierarchy extractions are required for the same dataset. The answer is yes in the tested workload: ScoreSG with optimized extraction is the fastest method in every dataset size where it can be compared directly against exact CoreSG and HDBSCAN.
Common comparison interval
The following figure compares cumulative runtime for the common interval in
which ScoreSG, exact CoreSG, and HDBSCAN measurements are all available
(N=5,000 through N=50,000).
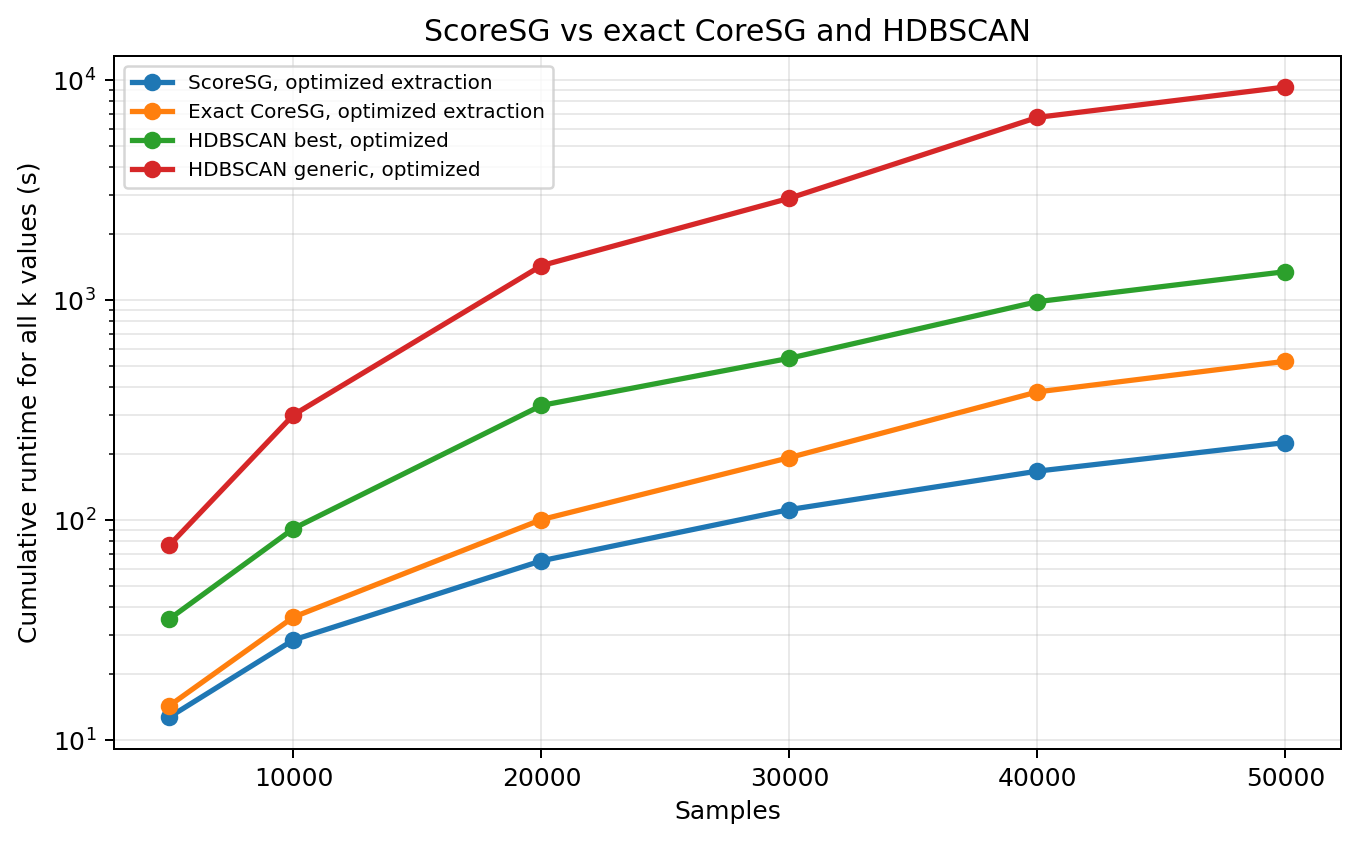
The cumulative runtime is reconstructed as build once plus all extraction
times for CoreSG and ScoreSG, and as the sum of independent executions for
HDBSCAN. This distinction is essential: ScoreSG and CoreSG are intended to
reuse support across many values of k, while HDBSCAN is rerun for each
target value.
At N=50,000, optimized ScoreSG completes the full 49-value multi-k
workflow in 224.36 s. The corresponding cumulative runtimes are
525.45 s for optimized exact CoreSG, 1,342.44 s for optimized HDBSCAN
best, and 9,272.92 s for optimized HDBSCAN generic. Thus, at the
largest directly comparable sample size, ScoreSG is approximately 2.34x
faster than exact CoreSG, 5.98x faster than HDBSCAN best, and
41.33x faster than HDBSCAN generic.
Method |
5,000 |
10,000 |
20,000 |
30,000 |
40,000 |
50,000 |
|---|---|---|---|---|---|---|
ScoreSG, optimized extraction |
12.69 |
28.44 |
65.10 |
111.28 |
166.37 |
224.36 |
Exact CoreSG, optimized extraction |
14.29 |
36.11 |
100.21 |
191.72 |
381.33 |
525.45 |
HDBSCAN |
35.43 |
91.22 |
331.03 |
542.19 |
980.50 |
1,342.44 |
HDBSCAN |
76.68 |
299.81 |
1,429.84 |
2,894.76 |
6,747.33 |
9,272.92 |
Scaling of the approximate path
The ScoreSG benchmark extends beyond the common interval and reaches
N=200,000 samples. This larger range should be interpreted as a ScoreSG-only
scaling study, because equivalent HDBSCAN and exact CoreSG measurements are not
available for the same sample sizes.
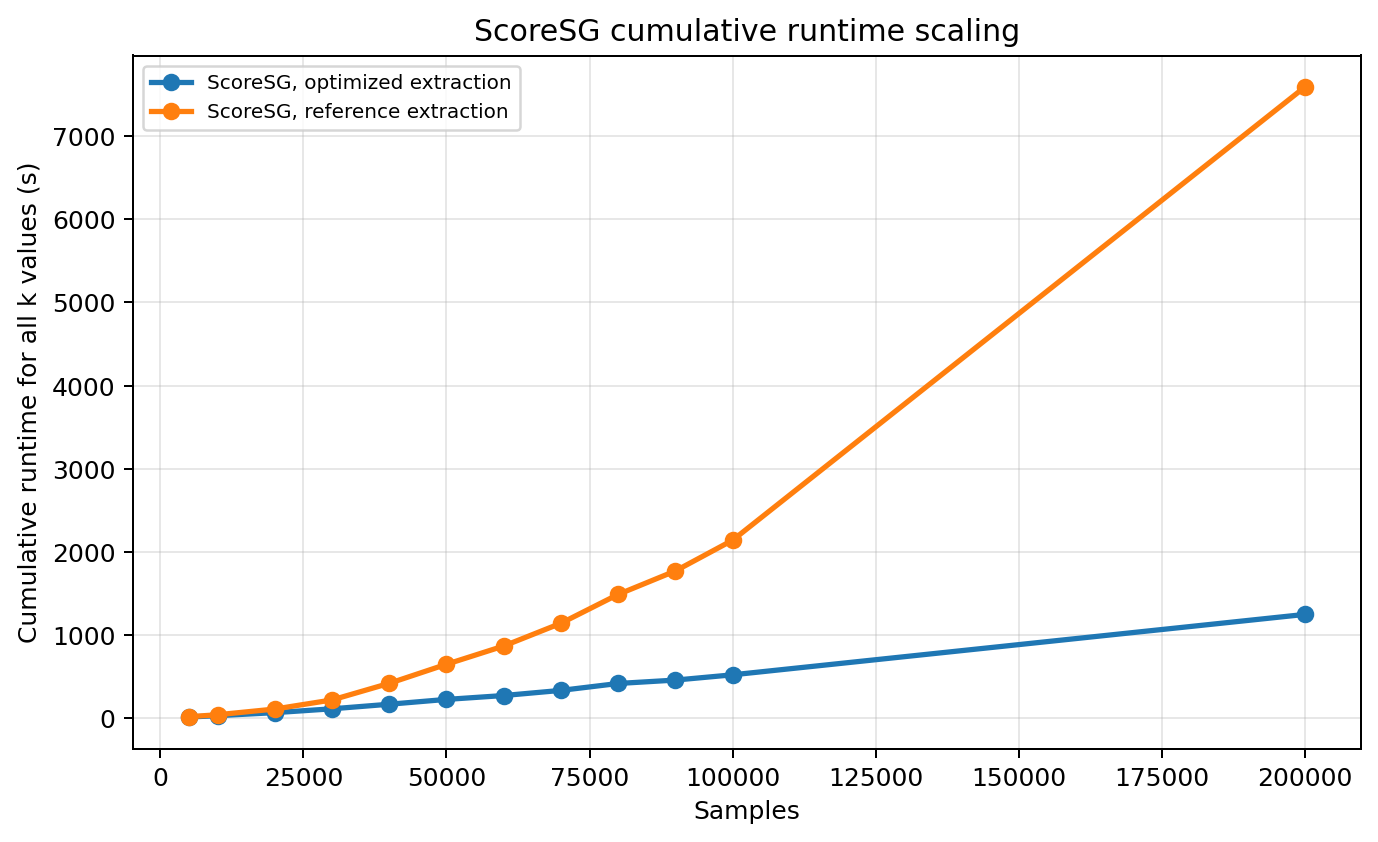
For optimized ScoreSG, cumulative runtime grows from 12.69 s at
N=5,000 to 1,246.93 s at N=200,000. A log-log power-law fit over
this interval gives an empirical exponent of approximately 1.26 for total
runtime. The reference extraction path grows much more quickly, with an
empirical exponent close to 1.70.
The difference between the two ScoreSG extraction paths widens with sample
size. The reference extraction path is 1.28x slower at N=5,000 but
6.09x slower at N=200,000. This indicates that the approximate graph
construction alone is not the full story: the optimized extraction routine is
also necessary to preserve the favorable scaling observed in the benchmark.
Interpretation
The main gain of ScoreSG comes from changing the cost structure of exploratory
analysis. HDBSCAN remains an important baseline, especially for single
executions, but in repeated multi-k workflows it pays the full execution
cost for every target value. ScoreSG instead pays for a reusable construction
and then performs repeated extractions.
The measured results suggest three practical conclusions:
ScoreSG is the best-performing option in the current repeated multi-
kbenchmark whenever optimized extraction is used.The approximate path provides increasing benefit as
Ngrows, especially compared with HDBSCANgenericand repeated HDBSCANbestexecutions.For large workloads, extraction optimization matters as much as graph construction, because cumulative extraction dominates total runtime after many values of
kare requested.
These results should still be read empirically. Approximate neighbor quality, data geometry, metric choice, and PyNNDescent settings can affect both runtime and clustering behavior. The current benchmark demonstrates a strong runtime advantage for the tested synthetic workload; broader claims should be supported by additional datasets and quality metrics.